Measure Mean Linear Intercept
Download
About
This plugin is designed to measure mean linear intercept by serial measurement of a test line overlaying an image. Our method has been validated using simulated data and used in several of our publications to assess pulmonary mean linear intercept. Our method could also be used for a variety of other applications, including the measurement of grain size in geological settings.
The zip file contains the plugin, a readme with instructions, and a non-commercial research use license. If you use this resource, please cite us (thanks!) [1]:
Crowley G, Kwon S, Caraher EJ, et al. Quantitative lung morphology: semi-automated measurement of mean linear intercept. Pulmonary Medicine. November 2019. https://doi.org/10.1186/s12890-019-0915-6
We have used this method in the following publications.[1][2][3]
For a full list of publications that have cited this method, see: Google Scholar, PubMed, or Web of Science.FAQs
- The plugin isn't working as expected. ImageJ/FIJI is not detecting that I have installed it. The plugin is currently only compatible with ImageJ v1.52 (not FIJI and not other versions of ImageJ). We are working to expand compatibility to FIJI. If you found a bug, please let us know!
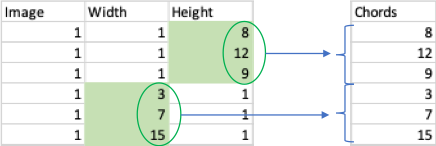
- What are the different columns in the results file? The BX and BY columns describe the location of each chord in the image, and the Width and Height columns contain the information you want (the actual chord lengths).
- How do I extract chord measurements from the results file? The following diagram describes how to extract chords for each image. What you then want is mean(Chords), and you can decide how to stratify your average (i.e. average per image/mouse/group).
- I'm still confused about how to deal with the chord lengths that I measured? (aka what/how am I supposed to average to get mean chord length?) There's a lot of freedom in terms of how you analyze chord lengths. Horizontal and Vertical Chords should be pooled (i.e. for whatever calculation you're doing, don't do it separately for horizontal and vertical measurements, group them all together). From here, you could calculate an average chord length per organism (i.e. per mouse) or per exposure group (i.e. mean of all chord lengths from experimental group vs. mean of chord lengths from control group).
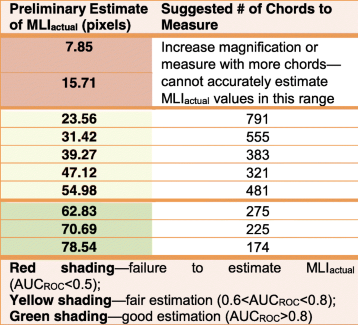
- What magnification should I use? How many chords should I measure? We have attempted to quantify the performance of this method based on how many chords you measure and their average size. Please see Table 1 of our method paper [1] (shown here under http://creativecommons.org/licenses/by/4.0/).
Hint: When measuring vertical chords, the Width is constant (1 pixel i.e. the width of the test line), and when measuring horizontal chords, Height is constant (again, 1 pixel). This is how you can tell which column contains the relevant measurements to extract as Chords. You need to measure both vertical and horizontal chords to account for potential distortion.
We have an example spreadsheet available to download that describes how one could average chords per experimental group and perform a t-test in excel. The BX and BY columns have been omitted for simplicity.
We are activley working to add more helpful information. If you couldn't find an answer to your question here, please refer to our publication [1] or reach out to us with questions!
References
- Crowley G, Kwon S, Caraher EJ, et al. Quantitative lung morphology: semi-automated measurement of mean linear intercept. Pulmonary Medicine. November 2019. https://doi.org/10.1186/s12890-019-0915-6
- Caraher EJ, Kwon S, Haider SH et al. Receptor for advanced glycation end-products and World Trade Center particulate induced lung function loss: A case-cohort study and murine model of acute particulate exposure. PLOS ONE. September 2017. https://doi.org/10.1371/journal.pone.0184331
- Haider SH, Veerappan A, Crowley G, et al. Multiomics of World Trade Center Particulate Matter-induced Persistent Airwayyperreactivity. Role Receptor for Advanced Glycation End Products. American Journal of Respiratory Cell and Molecular Biology. August 2020.https://doi.org/10.1165/rcmb.2019-0064OC